How to Calculate Project Profitability for Agencies: A Practical Guide
Project profitability is the profit a project generates after subtracting all costs required to deliver it: labor, contractors, expenses, and overhead. The core formula is project profit equals project revenue minus total project costs. This guide walks agencies through a repeatable method to calculate project margins, identify where costs accumulate, and track profitability in time to act on it, whether you use a spreadsheet, a finance system, or time tracking software.
💡 Quick Summary
Project profitability shows how much profit a project generates after subtracting the costs required to deliver it. To calculate project profitability, you can use basic formulas to calculate project profitability and gross project profitability
👉 For agencies, the best approach is to calculate project profitability using a repeatable and consistent method for each project. This allows you to compare margins accurately and understand where profit is gained or lost.
Core method:
- Start with actual project revenue.
- Calculate direct labor costs.
- Add contractors, tools, and project expenses.
- Calculate gross project profit and gross margin.
- Allocate overhead.
- Calculate net project profit and net margin.
- Compare estimated vs. actual profitability.
Agencies should also separate gross project margin from net project margin: gross margin shows how efficiently the project was delivered before overhead, while net margin shows whether the project remained profitable after all operating costs were included.
How to Calculate Project Profitability
- What Is Project Profitability?
- Gross Profitability vs. Net Profitability
- What Costs Go Into Project Profitability?
- Project Profitability Formula
- How to Calculate Project Profitability in 7 Steps
- Estimated Profitability vs. Real-Time Profitability vs. Retrospective Profitability
- How TrackingTime Helps Agencies Monitor Project Profitability
- Worked Example: How a Web Design Agency Calculates Project Profitability
- What to Do When Project Profitability Is Low
- Project Profitability Benchmarks
- Common Project Profitability Mistakes
- Calculate Project Profitability With a Repeatable System
What Is Project Profitability?
Project profitability is the amount of profit a project generates after subtracting the costs required to deliver it.
For agencies, it is important to understand that project profitability is not the same as revenue. Revenue is what the client paid. Profitability shows what remains after labor, contractors, revisions, client management, project expenses, and overhead are subtracted from total project revenue.
That is why project profitability should be measured at the project level, not only at the agency level. By tracking profitability by project, agencies can understand which work is truly profitable, which projects are underpriced, and where they are losing margin.
Gross Profitability vs. Net Profitability
Agencies should look at project profitability in two layers:
- Gross project profitability
- Net project profitability
Gross profitability shows how efficiently the project was delivered before overhead. Net profitability shows whether the project still made money after a reasonable share of operating costs was included.
| Metric | What It Measures | Costs Included | What It Helps You Understand |
|---|---|---|---|
| Gross profit | Profit after direct delivery costs | Internal labor, contractors, project-specific expenses | Whether delivery was efficient |
| Gross margin | Gross profit as a percentage of revenue | Direct project costs | How much margin delivery left before overhead |
| Net profit | Profit after direct costs and allocated overhead | Direct costs + overhead allocation | Whether the project was truly profitable |
| Net margin | Net profit as a percentage of revenue | Direct costs + overhead allocation | Whether the project supports sustainable agency growth |
Gross margin is useful for diagnosing delivery problems. If gross margin is low, the issue is usually tied to pricing, scope, labor estimates, contractor costs, or delivery efficiency. Net margin is more useful for answering the bigger question: did this project actually make money after the agency’s operating costs were considered?
What Costs Go Into Project Profitability?
Agencies often underestimate costs because they leave out less obvious expenses such as account management, extra revision rounds, contractor coordination, project-specific tools, or allocated overhead. When those costs are omitted, a project can appear profitable even if the actual margin is much lower.
Direct Project Costs
Direct project costs are the costs tied to delivering the project. They usually include internal labor, contractors, project-specific tools, production expenses, project management, client communication, revisions, and rework.
Allocated Overhead
Allocated overhead is a reasonable share of the business costs needed to run the agency, such as admin, operations, finance, management, office costs, and internal tools.
| Cost Category | Cost Type | What to Include | Why It Matters |
|---|---|---|---|
| Direct labor | Direct cost | Internal hours × internal cost rate | Usually the largest delivery cost |
| Contractors | Direct cost | Freelancers, developers, designers, specialists | Direct external delivery cost |
| Tools and software | Direct cost | Project-specific licenses, subscriptions, assets | Should be included when tied to delivery |
| Project management | Direct cost | Planning, coordination, meetings, follow-up | Sometimes underestimated or treated as “free” |
| Account management | Direct cost | Client communication, reporting, relationship management | Can quietly reduce margin |
| Revisions and rework | Direct cost | Extra rounds, fixes, changes, rescoping | Common cause of margin loss |
| Overhead allocation | Allocated overhead | Admin, operations, management, finance, office costs, internal tools | Shows a more realistic net margin |
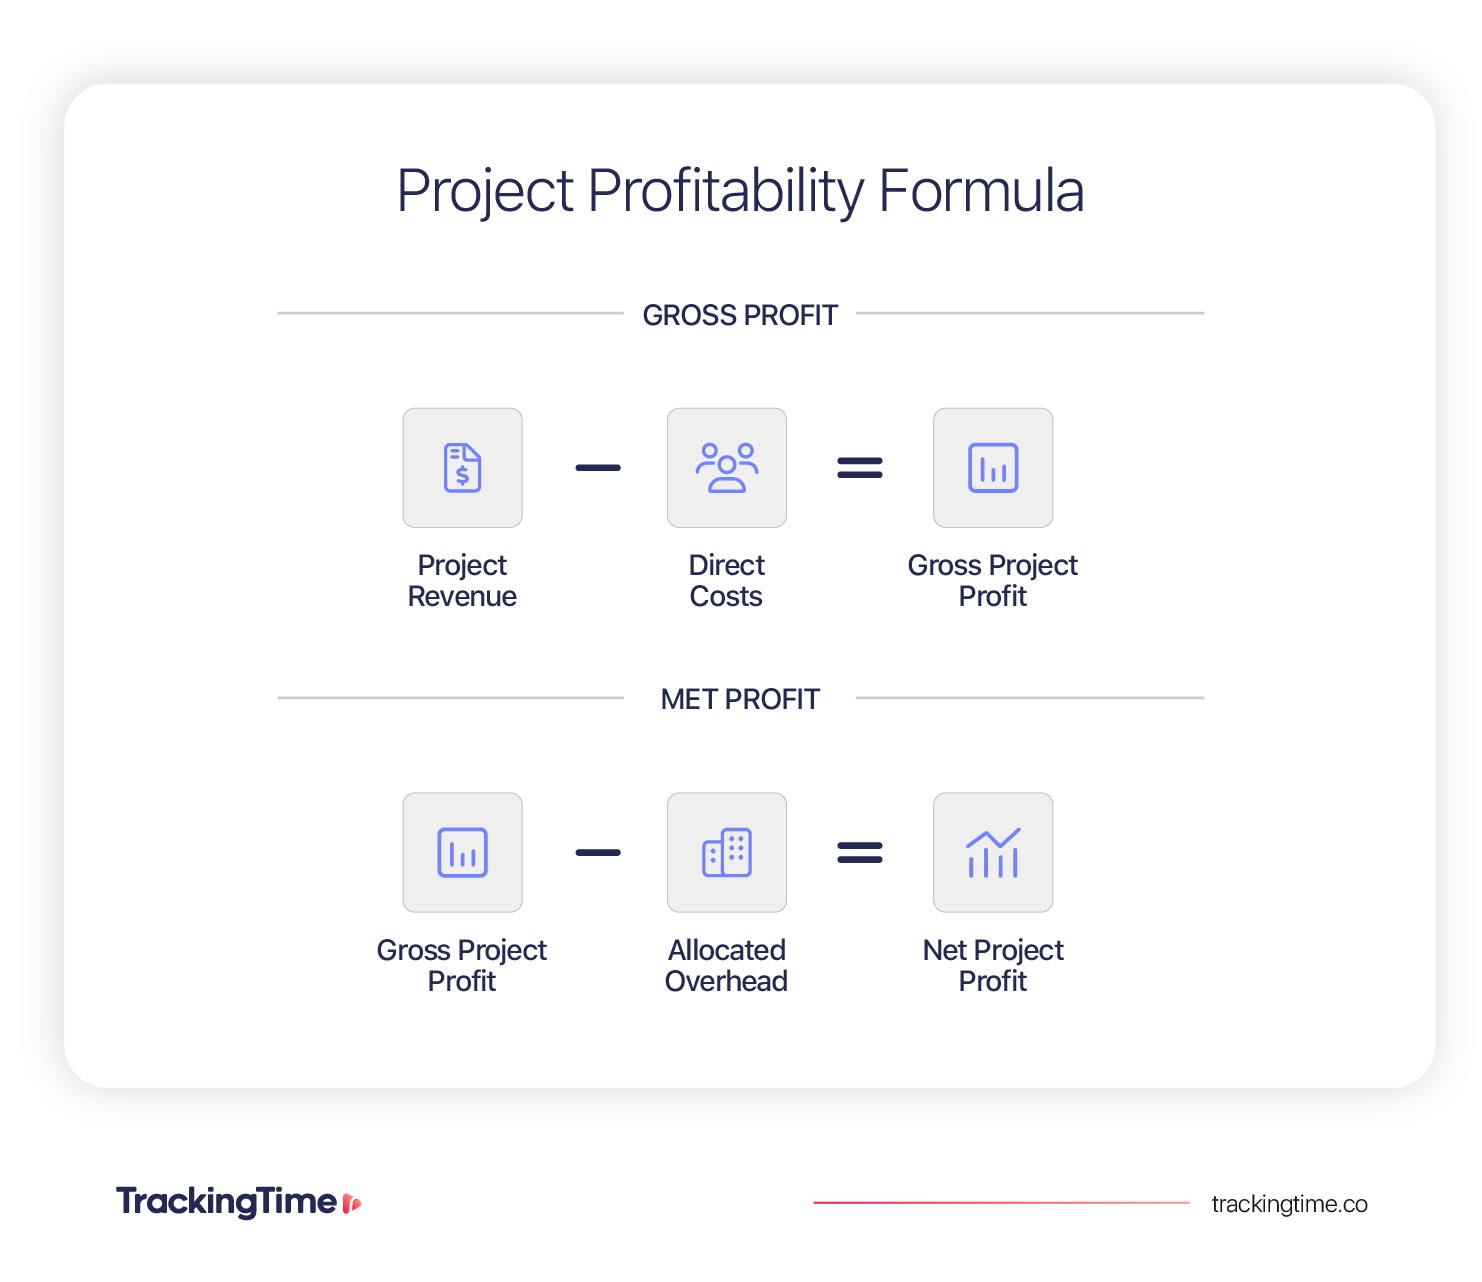
Project Profitability Formula
To determine project profitability, agencies need to calculate three things:
- Basic profit
- Gross margin
- Net margin
Basic Project Profitability Formula
Project profit = project revenue − total project costs
Enter revenue and total costs above to calculate project profit.
Gross Project Profit Formula
Gross project profit = project revenue − direct project costs
Gross project margin = gross project profit ÷ project revenue × 100
Enter revenue and direct costs above to calculate gross project profitability.
Net Project Profit Formula
Use net project profitability to measure whether the project remained profitable after overhead.
Net project profit = gross project profit − allocated overhead
Net project margin = net project profit ÷ project revenue × 100
Quick Example of Project Profitability Calculation
For example, if a project generates $20,000 in revenue and has $12,000 in direct project costs, the gross project profit is $8,000.
| Metric | Amount |
|---|---|
| Project revenue | $20,000 |
| Direct project costs | $12,000 |
| Gross project profit | $8,000 |
| Gross project margin | 40% |
| Allocated overhead | $2,000 |
| Net project profit | $6,000 |
| Net project margin | 30% |
In this example, the project has a 40% gross margin before overhead and a 30% net margin after overhead.
Gross margin = (revenue − direct costs) ÷ revenue × 100 | Net margin = (gross profit − overhead) ÷ revenue × 100
Enter revenue, costs, and overhead above to calculate project profitability.
What Is Project Profitability Ratio?
Project profitability ratio usually refers to the relationship between project profit and project revenue. In agency reporting, this is most often expressed as project profit margin. For example, a 30% project profit margin means the agency kept 30 cents of profit for every dollar of project revenue.
How to Calculate Project Profitability in 7 Steps
To calculate project profitability consistently, agencies need a repeatable workflow that connects project revenue, tracked hours, internal cost rates, expenses, overhead, and actual delivery effort. Here’s how to calculate project profitability in 7 steps.
1. Start With Actual Project Revenue
Start with the revenue the agency actually expects from a project. This is not always the same as the original quote or proposal amount.
Depending on the pricing model, project revenue may come from a fixed project fee, hourly billing, a portion of a retainer, change orders, or approved add-ons. Revenue should also reflect any discounts, refunds, or unapproved work that changed the final amount.
For example, if an agency quoted a website redesign at $30,000 but later gave a $2,000 discount, the project revenue used in the calculation should be $28,000, not $30,000.
2. Calculate Direct Labor Costs
Next, calculate the direct labor cost required to deliver the project. This includes the time spent by everyone involved in the work, such as designers, developers, project managers, account managers, copywriters, or any other team member who contributed to delivery.
⭐ Important: to ensure a precise cost calculation, use internal cost rates, not client billing rates. The billing rate is what the client pays. The internal cost rate is what the work actually costs the agency.
Labor cost = hours worked × internal cost rate
For example:
| Role | Hours | Internal Cost Rate | Labor Cost |
|---|---|---|---|
| Designer | 60 | $55/hour | $3,300 |
| Developer | 45 | $70/hour | $3,150 |
| Project manager | 25 | $50/hour | $1,250 |
| Total | $7,700 |
Labor cost = hours worked × internal cost rate
Enter hours and cost rates above to calculate total labor cost.
3. Add Contractors, Tools, and Project Expenses
On top of direct costs, you also need to add any external or project-specific expenses required to deliver the work. This includes freelancers, vendors, stock assets, hosting, software licenses, production costs, paid media, or any other cost tied to the project.
4. Calculate Gross Project Profit and Gross Margin
The next step is to calculate gross profit. This shows how much margin the project generated before overhead.
Gross project profit = revenue − direct costs | Gross project margin = gross profit ÷ revenue × 100
Enter project revenue and direct project costs above to calculate gross profit and margin.
5. Allocate Overhead
Overhead includes business costs that are not tied to a specific project but are necessary to run the agency, such as admin, operations, management, finance, rent, remote-work infrastructure, internal tools, and other non-client operational costs.
Overhead allocation does not need to be perfect. But ignoring it can make projects seem more profitable than they really are.
Agencies usually allocate overhead in different ways. The most common are:
- A percentage of project revenue
- A percentage of direct labor cost
- A share of total agency hours
- A fixed overhead rate per project
Allocated overhead = project hours ÷ total agency delivery hours × total monthly overhead
Enter project hours, total agency hours, and monthly overhead to calculate the allocation.
6. Calculate Net Project Profit and Net Margin
Net project profit = gross project profit − allocated overhead
Net project margin = net project profit ÷ project revenue × 100
Enter gross profit, overhead, and revenue above to calculate net project profitability.
7. Compare Estimated vs. Actual Profitability
The final step is to compare the profitability you expected before the project started with the profitability you actually achieved after delivery.
Estimated profitability is based on the original assumptions: project fee, planned hours, role mix, contractor costs, expenses, and overhead.
Actual profitability is based on what really happened: tracked hours, real delivery effort, extra revisions, client communication, project management time, and final costs.
Take into account that a project may have a lower-than-expected margin due to some of the following reasons:
- The original price was too low.
- The scope expanded without an approved change order.
- A specific phase took more hours than planned.
- Senior team members did more work than expected.
- Revisions or client communication took extra time.
- The team did not track hours accurately during delivery.
Estimated Profitability vs. Real-Time Profitability vs. Retrospective Profitability
Agencies should calculate project profitability at three moments:
- Before the project starts
- While the project is active
- After delivery
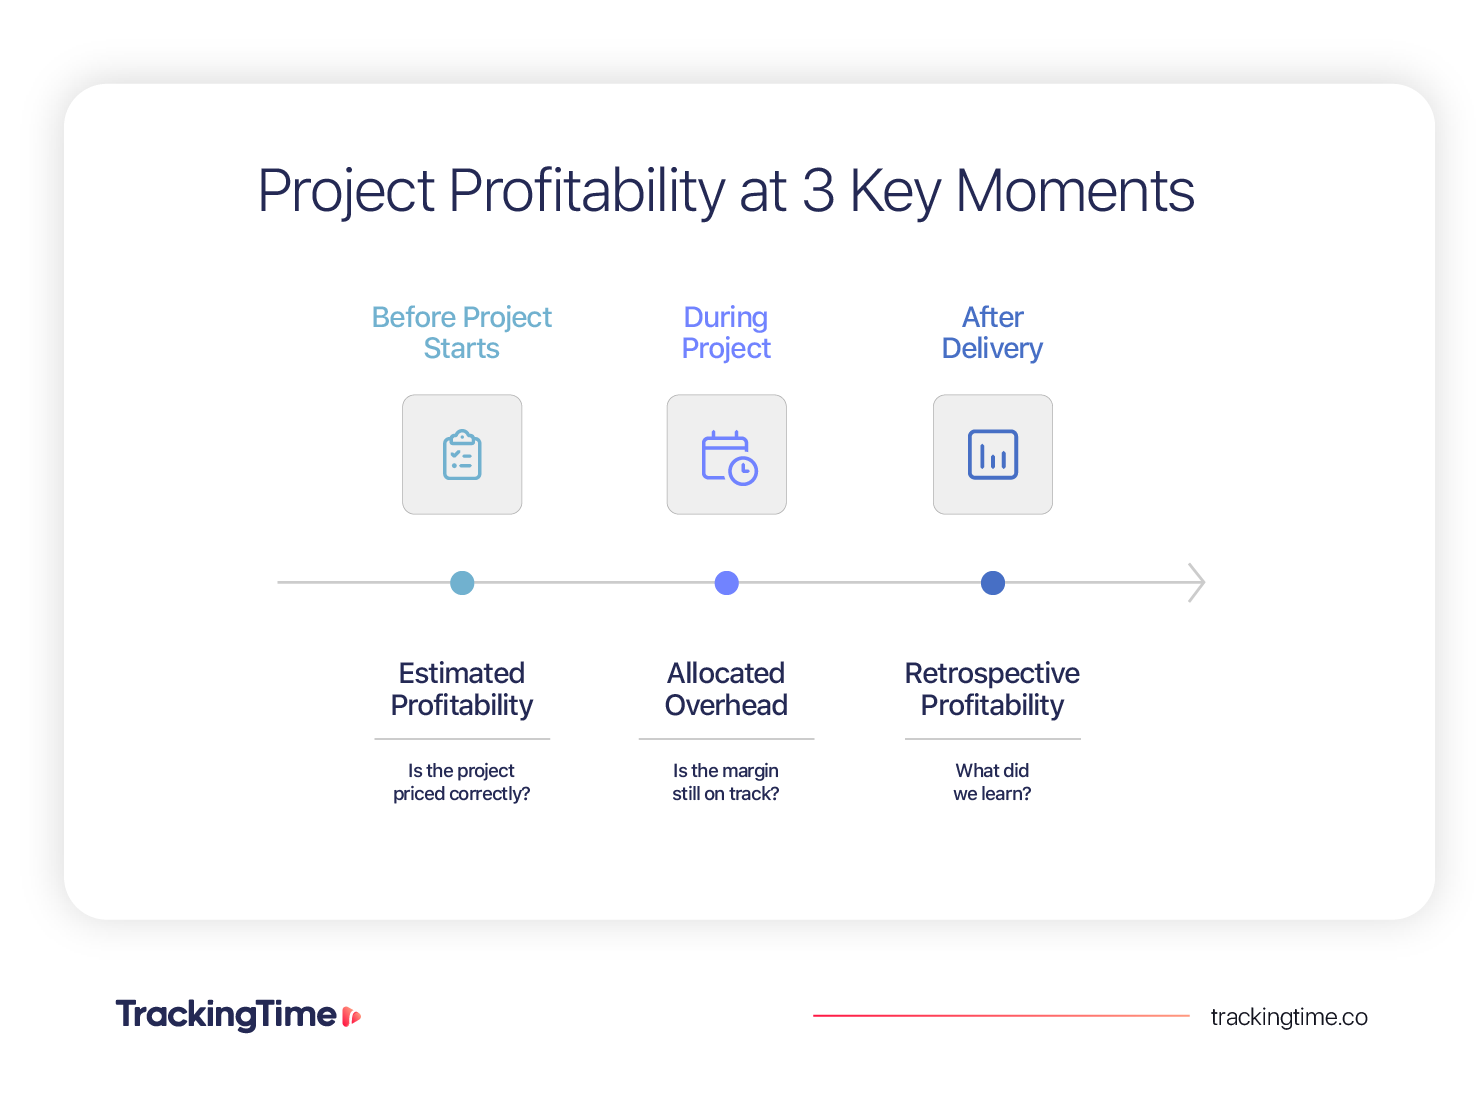
Each one answers a different question: should we take this project, is the project still on track, and what can we learn for future work?
| Type of Analysis | When It Happens | What It Helps You Do |
|---|---|---|
| Estimated profitability | Before the project starts | Price, scope, and staff the project correctly |
| Real-time profitability | During the project | Spot margin risk before it is too late |
| Retrospective profitability | After the project ends | Learn which clients, services, or project types are profitable |
Estimated profitability
Estimated profitability is calculated before the project starts. It uses the expected fee, planned hours, role mix, expenses, overhead, and target margin to decide whether the project is priced and scoped correctly.
Real-time profitability
Real-time profitability is monitored while the project is active. It compares actual hours, costs, and delivery progress against the original estimate so the team can adjust scope, staffing, or client expectations before the margin is gone.
Retrospective profitability
Retrospective profitability is calculated after the project is complete. It shows what actually happened and helps the agency improve future estimates, pricing, scoping, staffing, and client selection.
Common real-time warning signals include:
- Actual hours exceed estimates.
- Effective hourly rate drops.
- Revisions grow beyond scope.
- Project management time increases.
- Contractor costs rise.
- Client communication becomes heavier than expected.
- Milestones take longer than planned.
- Non-billable work starts accumulating.
How TrackingTime Helps Agencies Monitor Project Profitability
One key aspect of calculating project profitability is keeping the data accurate while the project is still active. TrackingTime helps agencies and service teams to:
- Track time by client, project, task, and team member.
- Compare estimated vs. actual hours.
- Separate billable and non-billable work.
- Apply billable rates and internal cost rates.
- Review project time by role, phase, or service type.
- Monitor project progress before preparing invoices.
- Use reports to understand where time and cost are accumulating.
This helps agencies understand whether margins were lost, monitor hours, costs, and delivery effort while there is still time to adjust scope, staffing, or client expectations.
Monitor project profitability with TrackingTime
Explore how TrackingTime’s time tracking software helps agencies track project hours, control costs, and compare estimated vs. actual effort before the project is over.
Worked Example: How a Web Design Agency Calculates Project Profitability
To see how the calculation works in practice, let’s look at a fictional example.
Luma & Co is a 12-person web design agency that recently completed a B2B website redesign project. The client approved the work, paid the full fee, and gave positive feedback. But when the team reviewed the actual delivery data, the net margin was lower than expected.
The Project
- Agency: Luma & Co
- Team size: 12 people
- Project: B2B website redesign
- Project fee: $30,000
- Estimated target net margin: 25%
Project Profitability Calculation
| Item | Amount |
|---|---|
| Project revenue | $30,000 |
| Strategy and planning labor | $2,400 |
| Design and production labor | $9,000 |
| Project and account management | $5,000 |
| QA, revisions, and handoff | $2,800 |
| Contractors | $3,000 |
| Software and assets | $600 |
| Total direct project costs | $22,800 |
| Gross project profit | $7,200 |
| Gross project margin | 24% |
| Allocated overhead | $3,000 |
| Net project profit | $4,200 |
| Net project margin | 14% |
The gross margin calculation shows how much margin was left after direct delivery costs:
$7,200 ÷ $30,000 × 100 = 24% gross project margin
After allocating overhead, the net margin was much lower:
$4,200 ÷ $30,000 × 100 = 14% net project margin
What the Example Reveals
The project looked healthy, but the final margin was lower than expected. The main reasons were:
- Revisions took more time than originally estimated.
- Account management time was not included clearly in the original budget.
- QA and development handoff required more hours than planned.
- Overhead allocation showed the real cost of supporting the project.
What The Agency Changed
After reviewing the project, the agency added account management time to future estimates, created a clearer revision policy, started reviewing estimated vs. actual hours during delivery, and tracked project phases separately.
Takeaways for readers
A project can be completed, paid, and still be less profitable than expected. Gross margin shows whether delivery was efficient. Net margin shows whether the project still supported the agency after overhead.
What to Do When Project Profitability Is Low
Low project profitability is a diagnostic signal. Once you know where margin was lost, you can decide whether the issue came from pricing, scope, staffing, delivery, overhead, or client management.
If Labor Costs Are Too High
Review the original estimate, actual hours, role mix, and staffing plan. Labor costs often increase when senior people do work that was planned for junior team members, when production takes longer than expected, or when the delivery process is not efficient enough.
If Gross Margin Is Low
Look at pricing, scope, direct costs, contractor usage, revisions, and actual hours. A low gross margin usually means the project was underpriced, overscoped, or more expensive to deliver than expected.
If Gross Margin Is Healthy but Net Margin Is Low
Review overhead allocation, internal operations, admin burden, management structure, and non-project costs. This usually means delivery was reasonably efficient, but the agency’s operating costs are reducing the final margin.
If Many Projects Are Low-Margin
Look beyond one project. Review pricing, service mix, client fit, scoping process, and whether the agency is taking on work that does not support sustainable growth. A single low-margin project may be a delivery issue. A pattern of low-margin projects is likely a business model issue.
Project Profitability Benchmarks
Project profitability benchmarks can help agencies understand whether a project margin is healthy, but they should be used as directional references, not universal targets.
It’s worth stressing that most public benchmarks are based on agency-wide profitability, not individual project profitability, so they are best used as context for reviewing project margins over time.
Margins vary by agency type, pricing model, service mix, seniority mix, overhead structure, and how much client management is required. In this sense, a creative agency with heavy strategy and revision cycles may have a different margin profile than a marketing agency with recurring retainers or a tech agency with higher specialist labor costs.
What Is a Good Profit Margin for an Agency Project?
A good project profit margin depends on the type of agency and the cost structure behind the work.
👉 As a broad agency benchmark, according to The Wow Company’s BenchPress 2025 report, gross profit for agencies fell below 40% that year, while the recommended gross profit target remains around 50%.
According to the Agency Management Institute’s (AMI) 55/25/20 model, a healthy agency should allocate 55% of its Adjusted Gross Income (AGI) to people costs, 25% to overhead, and protect the remaining 20% as net profit.
Digital agency benchmarks can be lower depending on service mix and growth stage.
👉 According to Promethean Research’s 2026 State of Digital Services report, average digital agency net margins reached 13%, while other agency guidance often frames 15%–30% as a healthy net profit range for agencies.
Benchmarks by Agency Type
| Agency Type | Margin Type | Benchmark Reference | Source |
|---|---|---|---|
| Creative agencies | Gross margin | Around 50% gross profit target; recent agency averages below 40% | BenchPress / The Wow Company |
| Digital agencies | Net margin | 13% average net margin (Promethean Research, 2026 report) | Promethean Research |
| Software development agencies | Net margin | 11% average net margin (Promethean Research, 2026 report) | Promethean Research |
| Studio shops/Boutique agencies | Net Margin | 19% average net margin (Promethean Research, 2026 report) | Promethean Research |
How to Use Benchmarks Without Overreacting
The best use of benchmarks is to compare similar agency projects over time. Creative projects should be compared with other creative projects. Marketing retainers should be compared with other retainers. Web or tech projects should be compared with similar delivery models.
Agencies should use gross margin to understand delivery efficiency, net margin to understand real profitability, and estimated vs. actual margin to understand whether the problem started in pricing, scope, or execution.
Common Project Profitability Mistakes
Even with the right formula, project profitability can be inaccurate if the inputs are wrong or inconsistent. These are the most common mistakes agencies should avoid.
Mistakes That Overstate Profitability
- Looking only at project revenue: assuming a high-fee project was profitable because the invoice was paid.
- Using billing rates instead of cost rates: confusing what the client pays with what the work actually costs the agency.
- Excluding overhead: making margins look higher by ignoring the agency costs needed to support delivery.
Mistakes That Hide Margin Leaks
- Not tracking revisions separately: makes scope creep harder to identify.
- Missing small client requests: leaving out short calls, async feedback, quick fixes, or “small” changes that add up over time.
- Waiting until the project ends: discovering margin problems when it is too late to adjust scope, staffing, or client expectations.
Inaccuracies That Make Projects Hard to Compare
- Using inconsistent cost categories: making profitability difficult to compare across clients, services, or teams.
- Changing the overhead method from project to project: making net margin unreliable.
- Comparing margins without context: ignoring project type, pricing model, team mix, client complexity, or scope control.
Calculate Project Profitability With a Repeatable System
Project profitability is a system for understanding whether pricing, scope, staffing, delivery effort, and overhead are working together.
To calculate project profitability accurately, agencies need to include project revenue, direct labor, contractors, project expenses, overhead, and actual tracked hours. They also need to separate gross margin from net margin, compare estimated vs. actual profitability, and monitor margin while the project is still active. The goal is to build a repeatable method for identifying profitable clients, spotting margin leaks earlier, and making better decisions about pricing, scope, and agency growth.
Track project profitability before margins disappear
See how TrackingTime helps agencies track project hours, compare estimated vs. actual work, and understand where time and costs accumulate before the project is over.